Extracting image features
Anchor contains several predefined tasks to extract features from images.
| Predefined Task | Features |
|---|---|
| feature/metadata | image metadata (width, height, number of channels etc.) (often runs quickly as the entire image must not be read). |
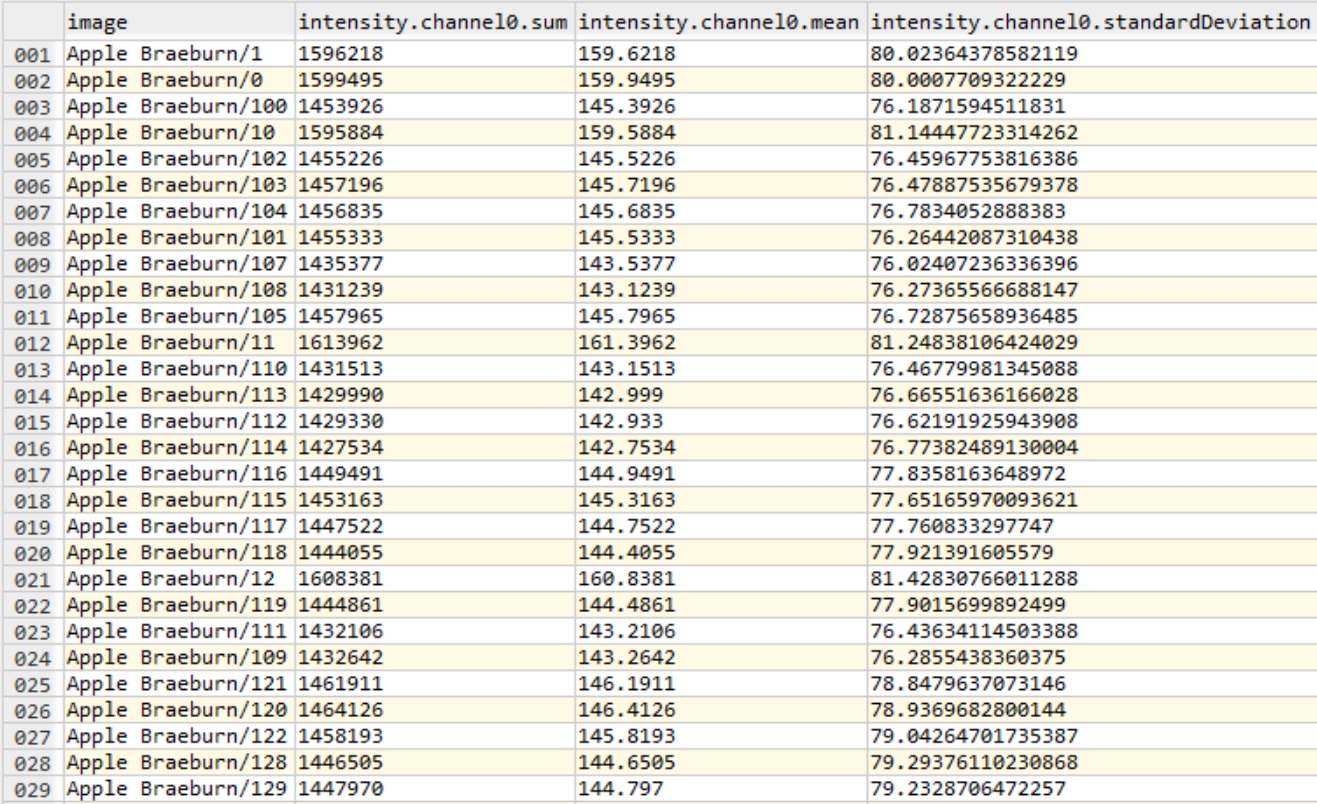
| feature/intensity | descriptive statistics on the pixel intensity values. |
| feature/hog | a HOG feature descriptor - given certain fixed parameters. |
Each task produces a features.csv CSV file, where each column represents a particular feature (and an identifier column) and each row represents a single input image.
Example: extracting metadata features
The predefined task feature/metadata will extract features from the image header like width, height, number of channels etc. also providing physical measurements in microns, if included in image metadata.
$ anchor -t feature/metadata
Experiment metadata_12.41.23 started writing to C:\Users\owen\AppData\Local\Temp\metadata_12.41.23
------------------------------------ Inputs ------------------------------------
The job has 3 inputs.

They are named with the pattern: ${0}
${0} = 3 unique integers between 13 and 91 inclusive
---------------------------------- Processing ----------------------------------
Preparing jobs to run with common initialization.
Using 7 processors CPUs from 8, and if needed and if possible, up to 0 simultaneous jobs using a GPU.
Job    2:       start   [  0 compl,   3 exec,   0 rem of   3]           78
Job    1:       start   [  0 compl,   3 exec,   0 rem of   3]           13
Job    3:       start   [  0 compl,   3 exec,   0 rem of   3]           91
Job    2:       end     [  1 compl,   2 exec,   0 rem of   3]   (5s)    78
Job    3:       end     [  2 compl,   1 exec,   0 rem of   3]   (6s)    91
Job    1:       end     [  3 compl,   0 exec,   0 rem of   3]   (7s)    13
All 3 jobs completed successfully. The average execution time was 6.700 ms.
----------------------------------- Outputs ------------------------------------
Enabled:        logExperiment, features, thumbnails
Disabled:       manifestExperiment, manifestJob
--------------------------------------------------------------------------------
Experiment metadata_12.41.23 completed (7s) writing to C:\Users\owen\AppData\Local\Temp\metadata_12.41.23
Note in the console messages:
- the start / end events for each input.
- the name of the input is indicated on the right-hand side - and a job’s total execution time.
- the output directory
C:\Users\owen\AppData\Local\Temp\metadata_12.41.23is printed twice, at the start and end.
The following files are produced:
features.csvwhere each row represents an input image, and each column an extracted feature.experimentLog.txtrecords the console output.- the
thumbnails/subdirectory, which contains a thumbnail for each row in the CSV file. - Only if an error occurs (which it didn’t!) then a job-specific log for
13_job_log.txtetc.
The latter is useful for visualizing features alongside each other via derived embeddings etc.
-o command-line option e.g. -o path_to_parent_directoryHere follows an example features.csv (with -t feature/intensity) from the fruits dataset:
Grouping
Features can also be assigned a group via the -pg command-line option:
anchor -t feature/hog -pg		# to group by the first identifier element (directory)
anchor -t feature/hog -pg 0		# identical to above
anchor -t feature/intensity -pg 0:-2	# to group by all elements, except the last

# like above, but enables other relevant outputs
anchor -t feature/intensity -pg 0:-2 -oe featuresAggregated,featuresGroup,featuresAggregatedGroup
This has four impacts:
- A
groupcolumn is added tofeatures.csv - Creates
featuresAggregated.csvwith group feature statistics (if thefeaturesAggregatedoutput is enabled). - Creates
featuresGroup.csvper group with feature values (if thefeaturesGroupoutput is enabled). - Creates
featuresAggregatedGroup.xmlper group with group statistics (iffeaturesAggregatedGroupis enabled).
Here follows an example featuresAggregated.csv (with -t feature/intensity) from sample of the fruits dataset:

Next steps
-
The CSV files can be visualized / processed in Excel, Python (pandas), R, Spotfire, Ron’s Editor, and similar.
-
The CSVs can be attached to images (as multi-inputs) for subsequent tasks in Anchor.