Maximum intensity projection
A maximum-intensity-projection can be applied:
- across slices in a 3D image (across the z-dimension)
- across multiple images
It finds the maximum across the corresponding voxels in many images / slices.
Across constant size images
anchor -t project/mean
Across varying size images
The following is similar to previous, but first resizes images to a particular size (1024x768 by default), and flattens any 3D image. This allows the operation to work with images of different sizes.
anchor -t project/meanResize
Example image
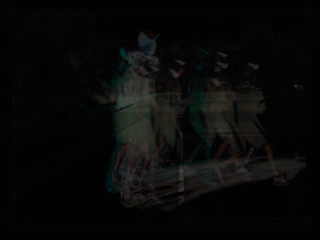
By way of example, we will show the results of the operation on some time-series images of a tennis player.
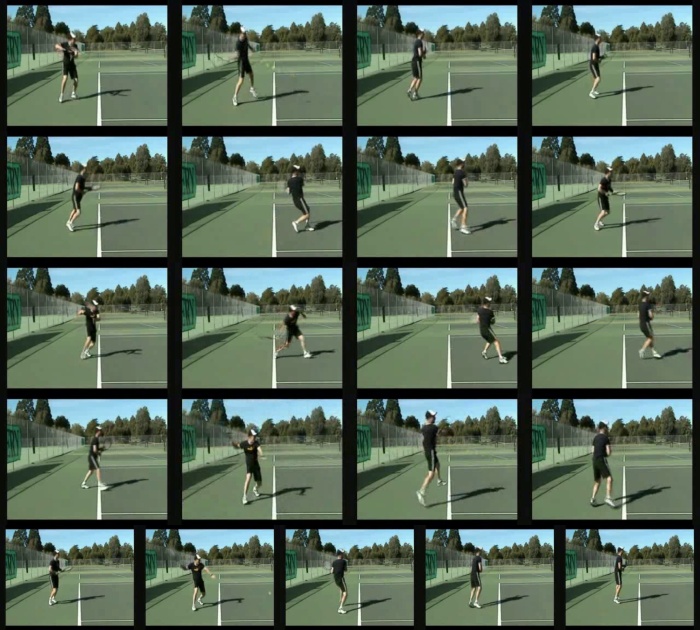
Note how the background is very similar across the frames.
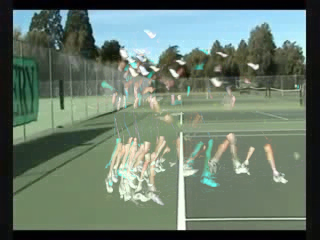
It produces a maximum-intensity-projection across the images:
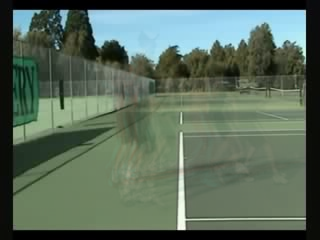
Mean intensity projection
This is similar to the previous projection except it finds the mean (average) of each voxel value across images.
It can be useful for background subtraction, or investigating the consistency of images.
anchor -t project/mean
anchor -t project/meanResize
Minimum intensity projection
And similarly, but to find the minimum across the corresponding voxels in many images.
anchor -t project/min
anchor -t project/minResize
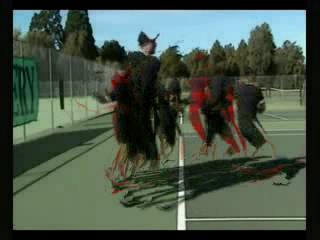
Standard-deviation intensity projection
And to find the standard-deviation across the corresponding voxels in many images.
This can be useful for identifying the pixels which change little over the course of a time-series.
anchor -t project/standardDeviation
anchor -t project/standardDeviationResize
The original tennis time-series images come from the UCF101 video classification dataset, downloaded from Kaggle.
Grouping
The images above all performed the projection on every input image. To instead, partition the inputs into groups, and perform a separate projection for each group use the -pg command-line option:
anchor -t project/meanResize -pg	# to partition by the first identifier element (directory).
anchor -t project/meanResize -pg 0	# identical to above
anchor -t project/min -pg 0:-2		# to partition by all elements, except the last.
anchor -t project/min -pg -1		# to partition by the last element.
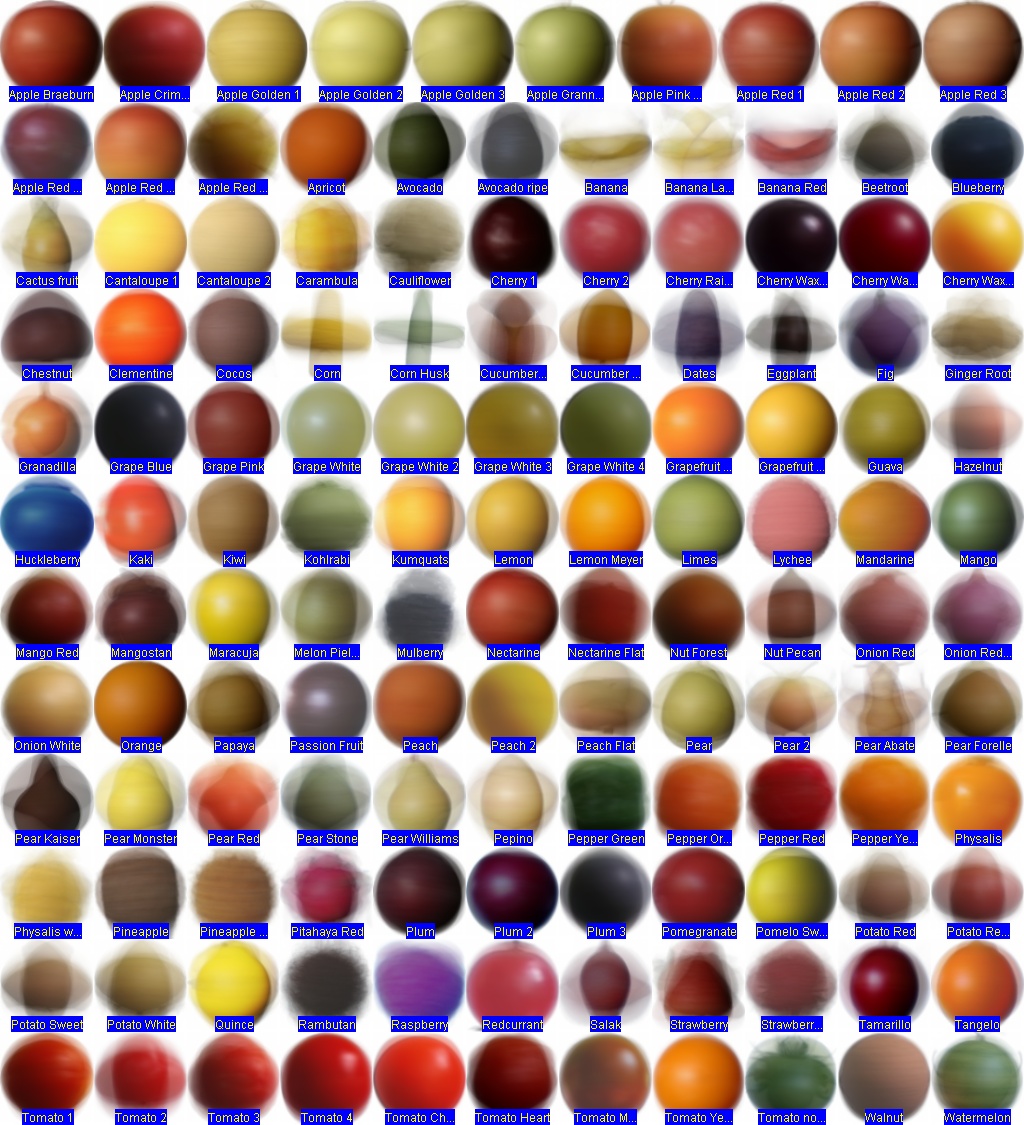
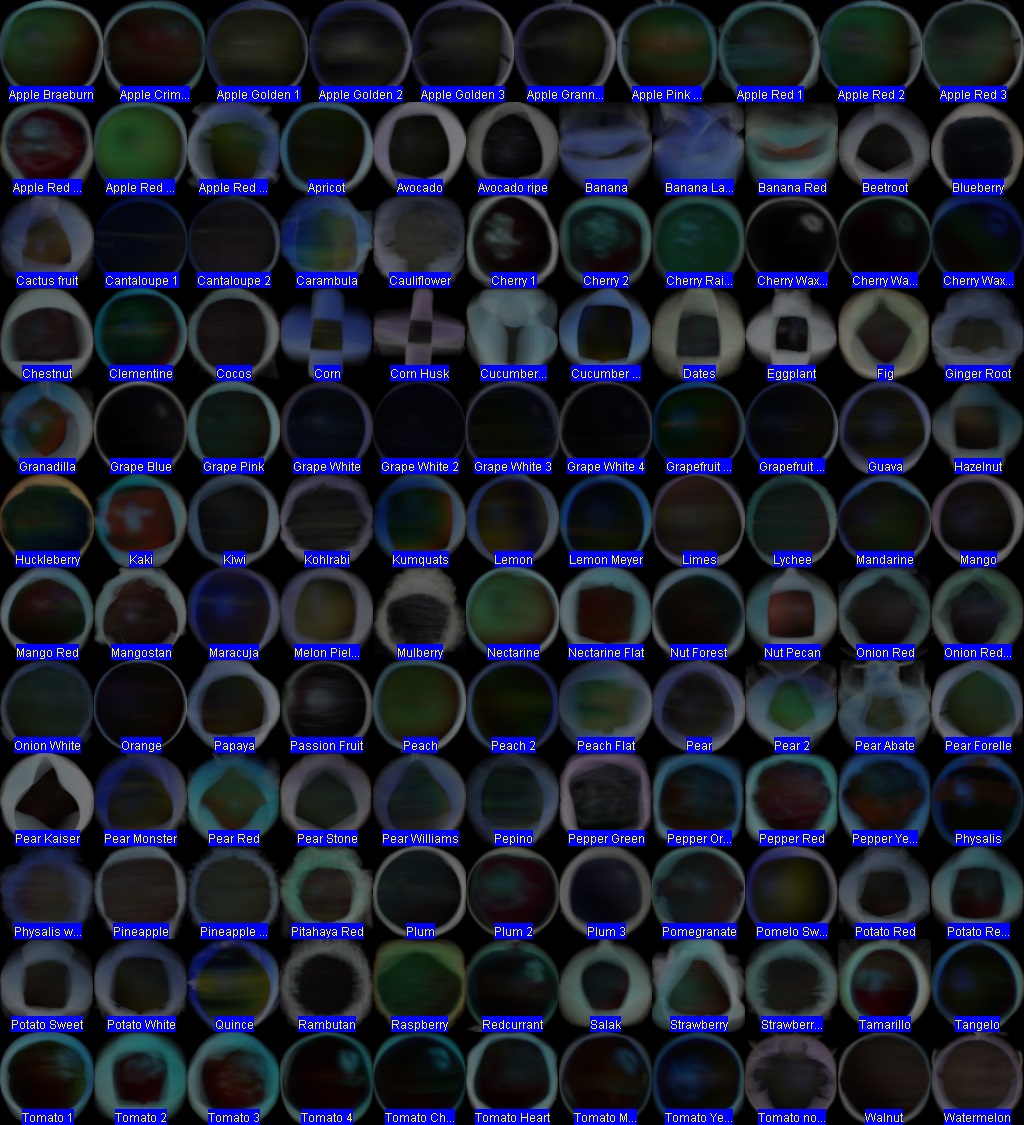
Examples (montaged together) follow of project/mean and project/standardDeviation, as applied on groups in the fruits dataset:
Next steps
- Use a projection to inform further analysis of time-series images / video, e.g:
- to background subtract the mean-intensity.
- to consider only regions with significant standard-deviation.