Background
Image histograms describe the color (pixel intensity) content of an image.
Generating histograms can be a useful first step for image exploration and understanding.
The histograms can be used in subsequent processing steps for normalizing operations, either against the image’s histogram itself, or against an aggregated histogram from many related images.
With classical image processing, popular thresholding algorithms like Otsu’s method use the image histogram (or histograms derived from image subregions) to determine appropriate thresholds.
With deep learning workflows, data normalization is also a popular step e.g. subtracting a mean intensity value from image channels. Here, histograms help explore and calculate appropriate normalization, including sanity checks on content.
This tutorial proceeds to show how Anchor can create histograms for each channel in an image, and derive a summed histogram aggregated across many images.
Inputs
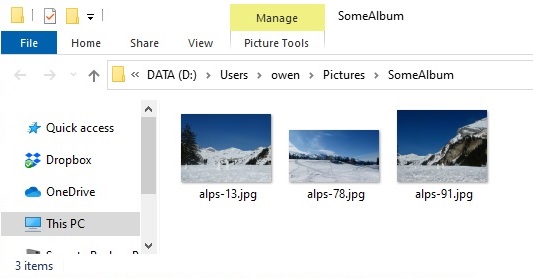
Consider an example album with three images. Running the command from e.g. D:\Users\owen\Pictures\SomeAlbum:
$ anchor
Searching recursively for image files. CTRL+C cancels.
Learn how to select inputs, outputs and tasks with 'anchor -h'.

Found 3 inputs.
-> with uniform extension = jpg
-> file-sizes range across [1 MB to 7 MB] with an average of 4 MB.
-> D:\Users\owen\Pictures\SomeAlbum\alps-${0}.jpg
${0} = 3 unique integers between 13 and 91 inclusive
Anchor has found 3 images in this directory, as described in Investigating image files, and inferred names (78, 91 and 13).
$ anchor -t list
78       -> D:\Users\owen\Pictures\SomeAlbum\alps-78.jpg
91       -> D:\Users\owen\Pictures\SomeAlbum\alps-91.jpg
13       -> D:\Users\owen\Pictures\SomeAlbum\alps-13.jpg
Task
Then let’s generate histograms:
$ anchor -t histogram -o ..
Experiment histogram_12.52.22 started writing to C:\Users\owen\Desktop\histogram_12.52.22
------------------------------------ Inputs ------------------------------------
The job has 3 inputs.

They are named with the pattern: ${0}
${0} = 3 unique integers between 13 and 91 inclusive
---------------------------------- Processing ----------------------------------
Preparing jobs to run with common initialization.
Using 7 processors CPUs from 8, and if needed and if possible, up to 0 simultaneous jobs using a GPU.
Job    1:       start   [  0 compl,   3 exec,   0 rem of   3]           13
Job    2:       start   [  0 compl,   3 exec,   0 rem of   3]           78
Job    3:       start   [  0 compl,   3 exec,   0 rem of   3]           91
Job    2:       end     [  1 compl,   2 exec,   0 rem of   3]   (5s)    78
Job    3:       end     [  2 compl,   1 exec,   0 rem of   3]   (6s)    91
Job    1:       end     [  3 compl,   0 exec,   0 rem of   3]   (7s)    13
All 3 jobs completed successfully. The average execution time was 6.628 ms.
----------------------------------- Outputs ------------------------------------
Enabled:        channels, logExperiment, sum
|- channels     blue, green, red
Disabled:       manifestExperiment, manifestJob
--------------------------------------------------------------------------------
Consider:
- the start / end events for each input.
- the name of the input is indicated on the right-hand side - and a job’s total execution time.
- the output directory
C:\Users\owen\Desktop\histogram_12.52.22is printed twice, at the start and end.
The output directory was calculated relative to the current working directory with -o .. and from the task and time.
Outputs
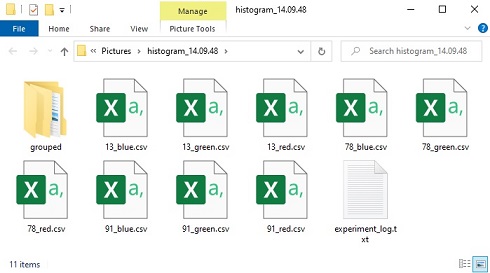
Many files have been created in the output directory:
- A histogram CSV for each channel of each image (
13_red.csv,13_green.csv,13_blue.csvetc.). - A subdirectory
sum/with aggregated histograms across all images. experimentLog.txtrecords the console output.- Only if an error occurs (which it didn’t!) then a job-specific log for
13_job_log.txtetc.
Grouping
The tasks above created a histogram for each image, and a summation of all images (in the sum/ subdirectory).
Instead of all images, separate summations can be produced for each group of inputs. Groups are derived from the input identifiers using the -pg command-line option:
anchor -t histogram -pg		# to group by the first identifier element (directory).
anchor -t histogram -pg 0	# identical to above
anchor -t histogram -pg 0:-2	# to group by all elements, except the last.
Next steps
- The
histogram_plot.pyscript will plot the produced CSV file as a histogram. - The CSV histogram files can be opened and processed in Excel, Python (pandas), R, Spotfire, Ron’s Editor, and similar.
- The histograms can be attached to images (as multi-inputs) for subsequent tasks in Anchor.
- Thresholds or color models can be calculated from the CSVs (e.g. using the
grouped/aggregates for robustness).- Consider Otsu’s method or Weighted Otsu.